Home PLS System level analysis
PLS

System level analysis

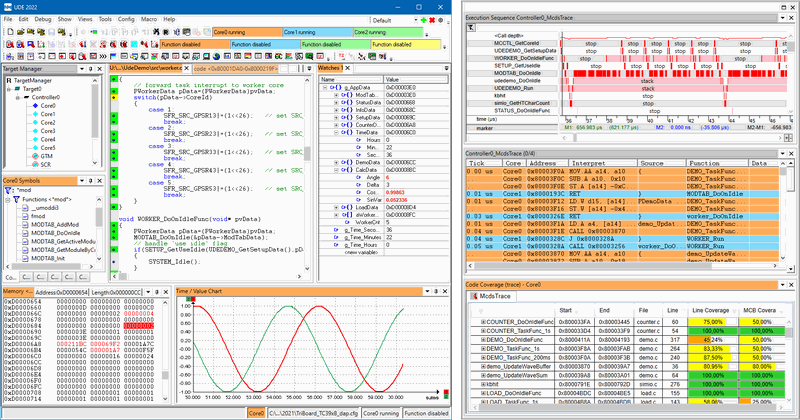
System-Level Analysis with UDE® Universal Debug Engine gives you clear insight into CPU load and runtime behavior across complex targets. It turns trace data into readable charts and tables, so you can profile functions, prove code coverage, and speed up optimization..

  • Detail
  • Special Features
  • Specification

UDE® helps you understand how load is spread across your CPUs. It collects instruction and data trace from sources like MCDS, NEXUS, ETM, and CoreSight, then groups samples by functions or code sections. If a sampled address does not match a known function, UDE® places it in the correct code region using debug symbols. For targets without continuous hardware trace, IP-Snooping samples the instruction pointer at a minimum 1 ms period to build usable profiling data.

You can view results as charts or numeric tables and export everything to XML for downstream work in Excel or through Windows Script. The UDE® object model exposes the same data for automated reporting, batch analysis, and CI workflows. For safety cases, UDE® streamlines code coverage. The Universal Emulation Configurator simplifies trace setup for specific code ranges and helps reconstruct control flow from debug info. You can collect proof using on-chip trace, Aurora trace into large external memory, or by running test cases on a simulator.

  • Unified views for profiling, code coverage, execution sequence, and variable access

  • Supports MCDS, NEXUS, ETM, and CoreSight code trace

  • IP-Snooping for AURIX, TriCore, XC166, XE166/XC2000, and Arm Cortex-M/R/A with 1 ms minimum poll period

  • Automatic function and section mapping for recorded addresses

  • Compact function trace modes supported for memory-efficient profiling

  • Saves results to XML data sinks for Excel or script-based processing

  • Full access via the UDE® object model for automation and post-processing

  • Trace configuration management powered by Universal Emulation Configurator

  • Works with on-chip trace, Aurora serial trace, up to 4 GB external trace memory, or simulator runs

  • Trace Sources: MCDS, NEXUS, ETM, CoreSight; IP-Snooping on AURIX, TriCore, XC166, XE166/XC2000, Cortex-M/R/A

  • IP-Snooping Rate: Minimum poll period 1 ms

  • Analysis Modes:

    • Profiling: function time and hit counts

    • Code Coverage: structural coverage for safety evidence

    • Execution Sequence: call hierarchy and timing sequence

    • Variable Access: time-based view of memory changes

  • Requirements By Mode:

    • Profiling: code trace with tick information

    • Code Coverage: code trace without tick information

    • Execution Sequence: code trace with tick information

    • Variable Access: data trace with tick information

  • Outputs: Chart views, numeric tables, XML exports, reports via UDE® Profiling page

  • Automation: UDE® object model for internal and external scripts

  • Trace Setup: Universal Emulation Configurator for targeted range collection and control-flow reconstruction

  • Memory & Interfaces: Supports on-chip trace, Aurora serial trace, up to 4 GB external trace memory, and simulator