Electrical Faults You Can Find Instantly with a Fluke Visual IR Thermometer
In the world of industrial maintenance and electronics debugging, invisible heat is often the first symptom of imminent failure. For decades, the standard tool for detecting this heat was the infrared (IR) spot thermometer (or "pyrometer"). While rugged and affordable, these pistol-grip tools suffer from a critical limitation: they are "blind." They provide a single temperature number for a specific spot, but they offer no context. They don’t show you the shape of the heat, nor do they tell you if a tiny, critical component just an inch away is overheating.
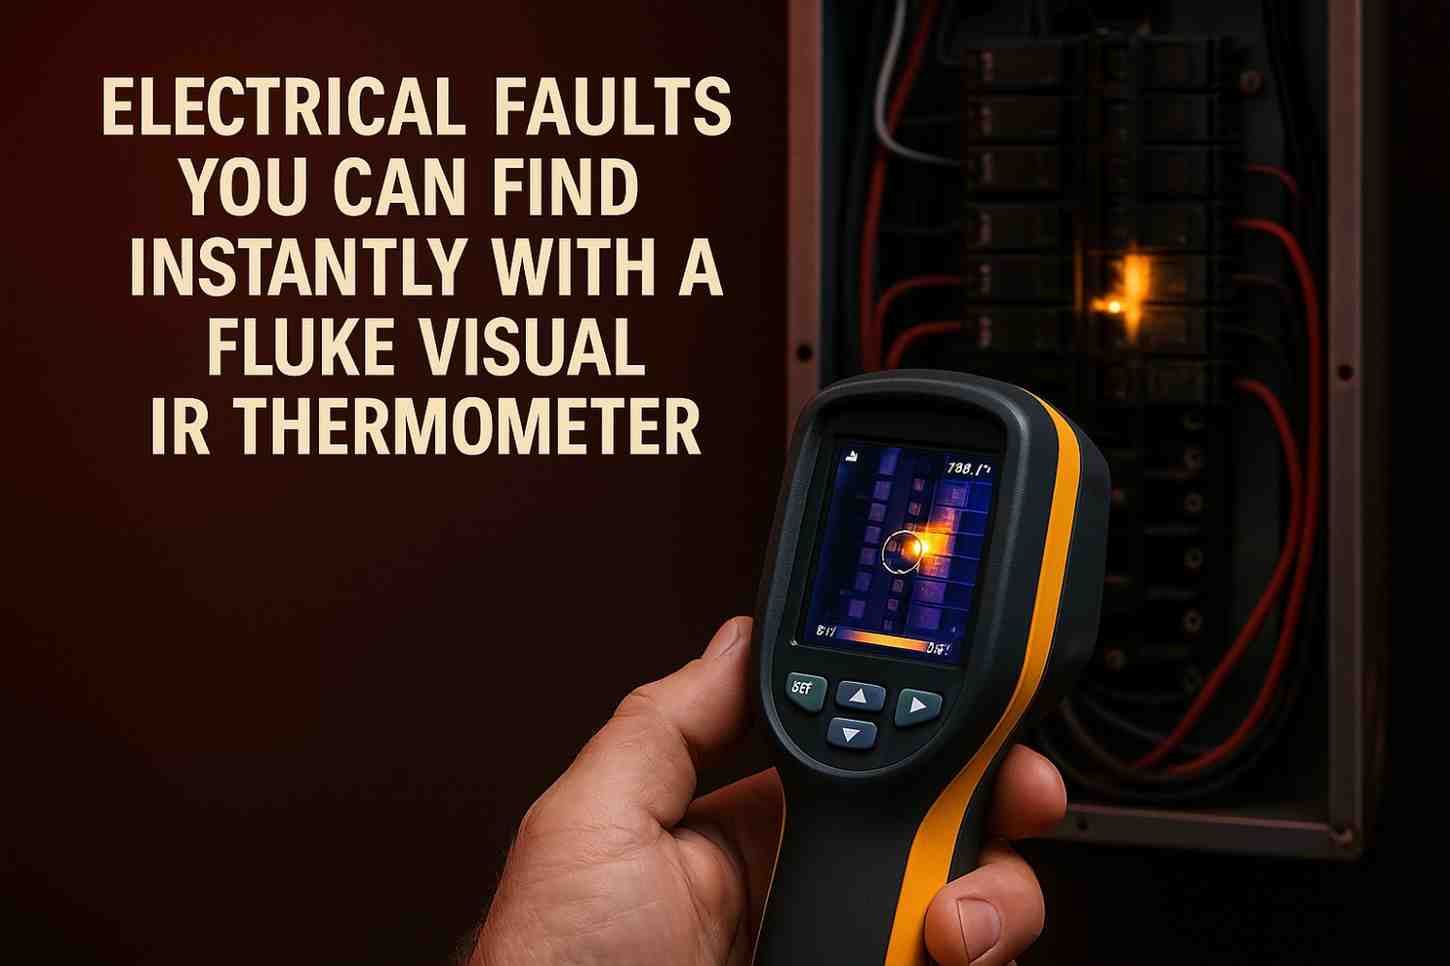
This limitation is the primary driver behind the industry's shift toward Fluke IR Visual thermometers (such as the VT06 and VT08 series). These devices bridge the gap between low-cost spot pyrometers and high-end radiometric thermal cameras. By utilizing pyroelectric arrays to blend a visible light image with a thermal heat map, they provide the one thing a simple number cannot: context.
For technicians and engineers, this context transforms a guessing game into a precise diagnostic science. Here is a deep dive into five specific electrical faults you can identify instantly using visual blending technology, along with the technical reasoning behind why they appear the way they do.
1. High-Resistance Junctions (Loose Connections)
The most prevalent cause of electrical panel failure is not the component itself, but the connection point. Whether due to thermal cycling (expansion and contraction loosening screws), vibration, or oxidation, a loose connection increases electrical resistance at the contact point.
The Physics of the Fault
According to Joule’s First Law ($H = I^2Rt$), the heat generated in a conductor is proportional to the square of the current multiplied by the resistance. Even a fractional increase in resistance at a loose lug—say, from 0.01 $\Omega$ to 0.5 $\Omega$—can generate massive amounts of localized heat when high current flows through it.
The "Visual IR" Advantage
If you scan a terminal block with a standard spot thermometer, you might read an average temperature of 50°C if your laser aim drifts slightly onto the insulated wire. You would mark it as "safe" and move on.
A Fluke IR Visual thermometer, however, displays a heat map that glows red or white specifically at the connection point. Because the thermal image is overlaid on a visual photo, you can see the heat gradient. You will observe a "hotspot" at the screw terminal that dissipates as it moves down the wire. This visual confirmation—that the heat originates at the junction and not the cable body—is actionable intelligence that a spot gun cannot provide.
Next Steps for Technicians:
Once a high-resistance junction is visually confirmed, the standard procedure is to de-energize the circuit and torque the connection to spec. For critical live circuits, engineers often verify the diagnosis using Digital Multimeters to measure the voltage drop across the connection (a healthy connection should have near-zero voltage drop).
2. Unbalanced Three-Phase Loads
In an ideal three-phase power system, the current (and therefore the thermal signature) should be balanced across all three phases (L1, L2, L3). However, in industrial environments where single-phase loads (lighting, IT equipment) are added haphazardly, phase imbalance is common.
The Physics of the Fault
When phases are unbalanced, the heavily loaded phase carries significantly more current, leading to higher $I^2R$ heating. Furthermore, severe imbalance causes current to flow through the neutral conductor, which is often undersized and prone to overheating.
The "Visual IR" Advantage
Diagnosing this with a multimeter or clamp meter requires three separate measurements and mental arithmetic. With a Visual IR thermometer, you can frame all three phases in a single shot. The visual heat map makes the imbalance obvious instantly.
-
The Image: You might see Phase A and Phase C appearing as cool blue/purple lines, while Phase B glows bright orange or red.
-
The Context: Because of the visual blending, you can immediately read the labels on the cables. You don't just know "one wire is hot"; you know "Phase B feeding the compressor" is the culprit.
Next Steps for Technicians:
A thermal imbalance prompts the immediate use of Power Quality Analyzers to quantify the imbalance percentage and check for harmonic distortion, which can also cause conductor heating.
3. Overloaded Circuit Breakers vs. Internal Contact Fatigue
One of the most valuable capabilities of Visual IR technology is distinguishing between an overloaded breaker and a defective breaker. To the naked eye, both look normal until they trip. To a spot thermometer, both just read "hot."
The Physics of the Fault
-
Overload: When a breaker passes current near its trip threshold, the entire bimetallic strip inside heats up. The thermal signature typically shows the entire body of the breaker glowing uniformly.
-
Internal Contact Fatigue: If the internal contacts are pitted or carbonized, the resistance creates heat focused centrally.
-
Connection Issue: If the heat is concentrated strictly at the top or bottom screw terminals, it is a tightening issue, not an overload.
The "Visual IR" Advantage
A Fluke IR Visual thermometer allows you to see the geometry of the heat.
-
Scenario A: You see a glow at the top screw terminal only. Diagnosis: Loose line-side connection.
-
Scenario B: You see the entire breaker body glowing yellow, while its neighbors are blue. Diagnosis: The circuit is likely overloaded or the breaker's internal mechanism is failing.
This distinction is critical. Tightening the screws on an overloaded breaker won't fix the problem, and replacing a breaker when the wire was just loose is a waste of money. The visual context prevents misdiagnosis.
4. Motor Bearing and Winding Faults
Motors are the workhorses of industry, and they often run hot by design. However, the pattern of the heat tells the story of the motor's health.
The Physics of the Fault
-
Bearing Failure: As lubrication breaks down or misalignment occurs, friction increases inside the bearing race. This generates intense, localized heat.
-
Winding Degradation: If the insulation on the stator windings begins to fail (turn-to-turn shorts) or if the motor is stalled, heat is generated in the stator coils.
The "Visual IR" Advantage
Scanning a motor housing with a visual IR tool reveals specific signatures:
-
Bearing Wear: You will see a distinct "bullseye" heat pattern on the front or rear bearing housing (end bell). The center of the motor shaft area will be the hottest point.
-
Winding Issues: You will observe a uniform, excessive heat pattern radiating across the main body (stator) of the motor, while the bearings might remain relatively cooler.
-
Cooling Failure: If the cooling fan is blocked or broken, the heat will accumulate at the non-drive end, or the entire motor will show a rising temperature gradient compared to previous baselines.
Next Steps for Technicians:
If winding faults are suspected based on the thermal pattern, further testing with Insulation Testers (Meggers) is required to check the dielectric integrity of the windings. For bearing issues, vibration analysis is usually the follow-up step.
5. Overheating Capacitors in APFC Panels
Automatic Power Factor Correction (APFC) panels contain banks of capacitors that improve energy efficiency. These components are prone to failure due to harmonics, ventilation issues, or age. A failing capacitor often bulges, but it heats up significantly before physical deformation occurs.
The Physics of the Fault
Capacitors degrade when their dielectric material breaks down, leading to increased leakage current and internal pressure. This process is exothermic. In a bank of 10 capacitors, one failing unit can raise the ambient temperature of the enclosure, shortening the life of the healthy units.
The "Visual IR" Advantage
Scanning a capacitor bank with a Fluke IR Visual tool allows you to perform a "surgical" strike. In a row of cool (blue/green) cylinders, a failing unit will stand out as a distinct hot (red/white) object.
Because capacitors are often tightly packed, a spot thermometer is nearly useless here—the laser spot might overlap two capacitors, giving an average reading that hides the fault. The Visual IR image outlines the specific cylinder that is overheating, allowing maintenance teams to order a replacement for that exact unit during the next scheduled downtime.
Technical Deep Dive: Why "Image Blending" is the Key
The defining feature of the Fluke VT series is not just the thermal sensor; it is the Image Blending technology.
The Resolution vs. Context Trade-off
Pure thermal cameras with high resolution (e.g., 320x240 pixels) are expensive. Lower-cost thermal cameras (e.g., 80x60 pixels) produce "blobby" images where it is difficult to identify objects.
The Fluke VT08 solves this by using a moderate-resolution thermal sensor (120x90 pixels) but overlaying that data onto a sharp visual image.
-
0% Blend: You see a standard digital photo.
-
50% Blend: You see the equipment clearly, with a semi-transparent heat map overlaid.
-
100% Blend: You see the thermal heat map.
By using the 25% or 50% blend modes, a technician can read the text on a breaker label through the heat signature. This effectively solves the "identifying the target" problem that low-resolution thermal cameras struggle with. It allows for high diagnostic confidence at a price point accessible to every technician.
Emissivity: The Hidden Variable
It is important to note that IR readings depend on emissivity the ability of a surface to emit infrared energy. Shiny copper busbars have low emissivity (they act like thermal mirrors), often showing false "cold" readings.
-
Expert Tip: When scanning shiny electrical connections, look for the heat on the insulation of the wire connected to the lug. The insulation has high emissivity (typically 0.95) and will provide a more accurate representation of the conductor's temperature.
Integrating Visual IR into Your Workflow
The Fluke IR Visual thermometer is best utilized as a "first-line" screening tool. It fits in a pocket and is rugged enough (IP65 rated) to survive the factory floor.
-
Scan: Walk the plant floor and scan panels, motors, and drives.
-
Detect: Use the visual blend to identify anomalies (hotspots relative to similar equipment).
-
Validate: Use contact tools like Clamp Meters or Oscilloscopes (for VFDs) to quantify the electrical root cause.
-
Report: Save the blended image to the SD card. A report showing a photo of a component with a glowing hotspot is far more convincing to facility managers than a spreadsheet of temperature numbers.
Conclusion
While high-end radiometric thermal cameras remain essential for detailed R&D and building envelope analysis, the Fluke IR Visual thermometer is the ideal "everyday carry" tool for electrical maintenance. It democratizes thermal imaging, allowing electricians to see the invisible and catch faults—loose lugs, unbalanced loads, and dying capacitors—before they result in catastrophic downtime.
By understanding the thermal signatures of these common faults, you turn a simple tool into a powerful asset for reliability and safety.
Frequently Asked Questions (FAQ)
Q: What is the difference between a spot thermometer and a Visual IR thermometer?
A: A spot thermometer provides a single temperature number for the small area you aim the laser at. A Visual IR thermometer provides a heat map overlaid on a digital photo, showing you the temperature distribution and context of the entire area.
Q: Can I use the Fluke VT08 for outdoor inspections?
A: Yes. The Fluke VT series carries an IP65 rating, meaning it is dust-tight and protected against water jets. However, direct sunlight can affect thermal readings on equipment, so it is best to scan shaded areas or inspect during cloudy days/evening hours.
Q: Do I need thermography certification to use a Visual IR thermometer?
A: No. Unlike complex radiometric cameras that require Level 1 or Level 2 certification to interpret accurately, Visual IR tools are designed for "point-and-shoot" troubleshooting. The visual context makes the heat map intuitive for any skilled electrician.
Q: Why does a shiny copper busbar look cold even if it is hot?
A: This is due to "low emissivity." Shiny metals reflect ambient infrared radiation (like a mirror) rather than emitting their own heat. To get an accurate reading, measure the insulation on the wire connected to the busbar, or apply a piece of black electrical tape to the metal surface as a target.
Q: Can the VT08 detect water leaks?
A: Yes. While designed for electrical and mechanical work, the thermal sensitivity is high enough to detect the temperature difference caused by evaporative cooling in wet drywall or insulation, helping to locate moisture intrusion.